Account Overview
Chapter 2
Getting Started
Chapter 3
Control Panel Overview
Chapter 4
FTP Instructions
Chapter 5
SSH / Telnet
Chapter 6
Email Software Setup
Chapter 7
File Manager
Chapter 8
Change Password
Chapter 9
Mail Manager
Chapter 10
Site Statistics
Chapter 11
Mailing List
Chapter 12
Microsoft FrontPage
Chapter 13
Site Creation Tool
Chapter 14
Counters
Chapter 15
Protect Directories
Chapter 16
Redirect URL
Chapter 17
Search Engine
Chapter 18
Formmail
Chapter 19
PGP & PGP Mail
Chapter 20
Mime Types
Chapter 21
Anonymous FTP
Chapter 22
Archive Manager
Chapter 23
SSL (Secure Server)
Chapter 24
MySQL
Chapter 25
Shopping Cart
Chapter 26
CGI-bin
Chapter 27
Real Audio / Real Video
Chapter 10 - Site Statistics
Introduction
Your account comes with HTTP-Analyze preinstalled and configured.
HTTP-Analyze is a log analyzer for web servers. It analyzes the logfile of a web server and creates a comprehensive summary report from the information found there. HTTP-analyze has been optimized to process large logfiles as fast as possible.
In easier-to-understand terms, HTTP-Analyze is a very powerful traffic analyzer that quickly and efficiently delivers you statistics on the traffic that your web pages have generated. It has a user-friendly graphical user interface (GUI) that by a click of your mouse button will produce your traffic reports.
Below we explain in more detail how this powerful software works with your web site, as well as provide you with definitions to the results you'll receive.
The web server is a program running on a networked machine, waiting for connections from the outside world to serve certain documents on behalf of a request by a browser.
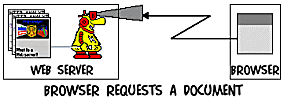
To communicate, the server and the browser use an asynchronous communication method called the HTTP (hypertext transaction) protocol. It works as follows:
- the user starts the browser and types in an URL
- the browser connects to the given host and requests the
specified document.

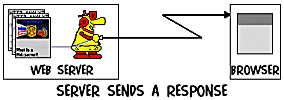
- The web server handles the request and sends out a
response:

- if this document exists, the web server delivers it,
- if it does not exist or if access is not permitted, the web server sends back an error message instead.
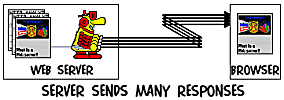
 The browser then requests all inline
objects of the current page from the server using the steps 2 and 3 above,
before it can display the content of that page.
The browser then requests all inline
objects of the current page from the server using the steps 2 and 3 above,
before it can display the content of that page.This communication method is called asynchronous, because the browser sends out many requests for inline documents at once (without waiting for a response from the server before sending the next request) using different communication channels:
 Since the browser's requests are often
handled by different server processes or different threads of a server process,
there is absolutely no relationship between the logfile entries caused by the
responses from the server due to a request of a document and it's inline
objects.
Since the browser's requests are often
handled by different server processes or different threads of a server process,
there is absolutely no relationship between the logfile entries caused by the
responses from the server due to a request of a document and it's inline
objects.For example, the order in which the server logs the successful transmission of the document itself and the inline images contained therein is not predictable and depends on the type of documents, objects, server speed, system and network load, and many other parameters.
What is logged?
Each and every response from the server - whether it indicates success, an error, or even a timeout (i.e. no response) - gets logged in the server's logfile. Since the server was hit by a request, such a response is called a Hit. In other words, the total number of hits must equal the total number of lines in the logfile minus the number of corrupt and empty lines. A typical logfile entry in the Common Logfile Format looks like:
hostname-[01/Feb/1998:10:10:00 +0100]"GET/index.html HTTP/1.0"200 4839The hostname field contains the full qualified domain name (FQDN) of the site accessing your server (see »Special Cases« below). The next two fields usually contain a minus (`-') to indicate that those fields are empty. The date is surrounded by square brackets ('[' and ']'). The next field contains the request. It contains the request method ('GET' for example), the name of the requested document (URL), and the protocol specification ('HTTP/1.0').
The following field contains the servers response code ('200' stands for an 'OK', while '404' would mean 'Document not found', for example). The last field contains the size of the document (some servers log the number of bytes transferred actually, while other servers log the size of the document, which makes a difference if the user interrupts the transfer before the document could be transmitted completely.
There are two other logfile formats, the Combined or Extended Logfile Format. Those formats add the user-agent (browser type) and the referrer URL (the page, which contains a link to the requested document if this request for such document has been generated by following a link) to the logfile entry. Those Combined or Extended Logfile Format append following two fields to the Common Logfile Format (CLF) in one of two usual ways:
CLF Mozilla/2.0 (X11; IRIX 6.3; IP22) http://foo/bar.html
CLF "http://foo/bar.html" "Mozilla/2.0 (X11; IRIX 6.3; IP22)"
Note that in the second form, the user-agent and the referrer URL are surrounded by double quotes, which makes them ambiguous in certain cases such as erroneous referrer URLs, which contain double quotes. Therefore, the first form should be preferred if possible.
The entries shown above are the only information the server records in the logfile. There might be much more information being transferred from the browser to the server, but although this additional information is available through CGI-scripts running on your server, it gets not logged in the logfile. Therefore, HTTP-analyze can only show you a summary of the information in the logfile - nothing more, nothing less.
Special Cases
Caching in the browser:
As soon as a page has been saved in a browser's disk cache, the browser might send out conditional requests for documents or inline objects. This conditional request ask the web server to only send a document/object if it has been modified since the last time the page has been requested (if the page is still in the browser's cache). This way, network traffic is reduced somewhat, since documents must be transferred only if they have changed recently. If such a conditional request arrives, the server will respond with a Code 304 (Not Modified) status to indicate that the document hasn't changed or with a Code 200 (OK) status if it has changed in the meantime. Since the browser may be configured (and usually is so by default) to only send out such conditional requests once per session and otherwise unconditionally use the copy from the cache, you may not even see a Code 304 response if this users visits your site again in the same session. Conditional requests are then sent out only if the user terminates the browser session and later restarts the browser.
Caching in a proxy server:
Organizations with a large number of users - such as companies, universities, or online providers - often use a so-called proxy server for mainly two reasons:
- Often such organizations have a firewall to protect their internal network against intruders. This means, that their network is logically separated from the rest of the Internet and that they have to use such a proxy server, which is able to communicate with the inside and the outside of their local network.
- To reduce network load somewhat, the proxy server acts as a local copy machine: As soon as a page is loaded into a browser through such a proxy server, the proxy saves a copy of this page in it's disk cache much like a browser does in the scenario above. This way, documents requested very often by users in the same local network need to be transferred to the proxy only once, which then answers future requests for the same page from it's local cache instead of connecting to the original web server the document originated from.
Definition of Terms
The statistics report contains among others the following information:
| Term | Color | Meaning |
| Hits | A hit is any response from the server on behalf of a request sent from a browser. This includes any response from the server, not only text files or documents. If, for example, a HTML page has two images embedded, the server generates three hits if this page is requested: one hit for the HTML page itself and two hits for the two inline images. | |
| Files | If the user requests a document and the server successfully sends back a file for this request, this is counted as a Code 200 (OK) response. Any such response is counted for as a file. Again, "file" here means any kind of a file. | |
| Code 304 | A Code 304 (Not Modified) response is generated by the server if a document hasn't been updated since the last time it was requested by the user and therefore there was no need to actually send the files for this document. This happens if the browser (or a caching proxy server between the browser and your web server) still has an up-to-date copy of the page in it's local storage (cache) and therefore can display the page without requesting the actual content. This technique is used to reduce network traffic, but it also causes an inaccuracy in the statistics reports regarding the number of visitors, because the browser or proxy usually sends only one such a conditional request per user session if it still holds an up-to-date copy of the file. However, the ratio between files and 304's reflects the efficiency of overall caching mechanisms for at least those hits which made it's way to the server. | |
| Pageviews | Pageviews are all files which either have a text file suffix (.html, .text) or which are directory index files. This number allows to estimate the number of "real" documents transmitted by your server. If defined correctly, the analyzer rates text files (documents) as pageviews. Those pageviews do not include images, CGI scripts, Java applets or any other HTML objects except all files ending with one of the pre-defined pageview suffixes, such as .html or .text. | |
| Other responses | There are much more responses than only Code 200 (OK) and Code 304 (Not Modified) responses, especially in the coming standard, the HTTP 1.1 protocol specification. For example, the server could generate a Code 302 (Redirected) response if a page has moved, a Code 401 (Unauthorized Request) response if access to the document is denied or a Code 404 (Not Found) response if the requested page does not exist on this server. | |
| KBytes transferred | This is the amount of data sent during the whole summary period as reported by the server. Note that some servers log the size of a document instead of the actual number of bytes transferred. While in most cases this is the same, if a user interrupts the transmission by pressing the browser's stop button before the page has been received completely, some servers (for example all Netscape web servers) do not log the amount of data transferred but the amount of data which would have been transferred if the user would have completely loaded the page. | |
| KBytes requested | This is the amount of data requested during the whole summary period. http-analyze computes this number by summing up the values of KBytes transferred and KBytes saved by cache (see below). | |
| KBytes saved by cache | The amount of data saved by various caching mechanisms such as in proxy servers or in browsers. This value is computed by multiplying the number of Code 304 (Not Modified) requests per file with the size of the corresponding file. Note: Because http-analyze can determine the size of a file only if the file has been requested at least once in the same summary period, the values for KBytes saved by cache and KBytes requested are just approximations of the real values. | |
| Unique URLs | Unique URLs are the number of all different, valid URLs requested in a given summary period. This shows you the number of all different files requested at least once in the corresponding summary period. | |
| Unique sites | This is the sum of all unique hosts accessing the server during a given time-window . The time-window is hardwired to the length of the current month. This means that if a host accesses your server very often, it gets counted only once during the whole month. Only the sum of the unique hosts per month is listed in the statistics report. | |
| Sessions | Similar to unique sites, this is the number of unique hosts accessing the server during a given time-window. This time-window is one day by default for backward compatibility, but it can be changed with the option -u or the Session directive in the configuration file. For example, if the time-window is two hours, all accesses from a certain host in less than 2 hours after the first access from this host are lumped together into one session. All following accesses more than 2 hours apart from the first access will be counted as a new session. This way you may get an estimated number of how many sessions are started on different sites to access your server. |
1 shown only on the total summary page.